Built for one thing:
predictive accuracy.
Not for participation points. Not for confederation balance. Every probability you see in the app is the output of 125+ years of international football data, four model enhancements, and 10,000 simulations of the full tournament (Monte Carlo) — run fresh after every result.
The FIFA rankings reward participation. Ours reward performance.
The official FIFA rankings reward participation, weight recent results too heavily, and treat a 1-0 squeaker the same as a 5-0 demolition. A team's ranking can be inflated by scheduling the right opponents at the right time.
Our model doesn't care about any of that. It cares about one question: which team is most likely to win their next match? Everything in the engine is built toward answering that question accurately.
Four upgrades that matter.
Base ELO is the gold standard — used in chess, tennis, and every serious football analytics operation in the world. We use it as the foundation and build four targeted enhancements on top.
Goal Difference Multiplier
Official rankings treat a 1-0 win the same as a 5-0 blowout. We don't. A 5-0 win genuinely tells you more about a team's quality than a 1-0 win does. We apply a Goal Difference Multiplier that scales with margin of victory — reflecting real dominance, not just results.
Neutralised for 2026
Home advantage is real and measurable. During training we apply a 100-point home field adjustment to account for crowd, travel, and familiarity. But since the 2026 World Cup is played at neutral venues across the USA, Canada, and Mexico, no home adjustment is applied to tournament predictions. Every team starts on a level playing field.
Dynamic K-Factor
Not all games are equal. A World Cup final tells you far more about a team than a March friendly. We use a Dynamic K-Factor that weights major tournament matches up to 3× more heavily than friendlies. When the stakes are highest, the ratings reflect who actually steps up.
125+ Years · 309 Teams
Short-term models are noisy. Our engine learns from every international match on record — 125+ years of data covering 309 national teams, stretching back to 1900. This deep historical baseline gives stable, reliable ratings that don't overreact to a single good or bad result.
Does ELO actually work for
international football?
The criticism is real but misunderstood. It's true that national teams play far fewer matches than club sides — typically 8–12 competitive matches per year vs 50+ for top clubs. This makes ratings slower to update and more sensitive to small sample sizes. We address this with our 125+ year training window: more data means more stable ratings.
The stronger evidence: ELO was validated for international football by a 2009 peer-reviewed study comparing 8 different rating methods. ELO had the highest predictive accuracy of all methods tested. FIFA agreed — they switched their own official world rankings to an ELO-based system in 2018 specifically because it outperformed their previous methodology.
ELO doesn't claim to know who will win. It says: given everything we know about these two teams' history, Spain wins this match 76% of the time across many similar matchups. That's an honest probability, not a prediction.
A peer-reviewed study compared 8 football rating methods. ELO had the highest predictive accuracy of all of them — outperforming methods that used more complex inputs.
FIFA replaced their previous ranking system with an ELO-based methodology specifically because of its superior predictive performance. We use the same foundation, with four targeted enhancements.
Close matchups between similarly-rated teams, and teams in rapid transition (new manager, retiring generation). We're honest about this — it's why we show probabilities, not predictions.
WSP Rankings vs. FIFA Rankings.
| WSP Rankings | FIFA Rankings | |
|---|---|---|
| Based on | WSPMatch results + goal difference, ELO-weighted | Points system weighted by confederation and participation |
| Home advantage | WSPModelled during training; neutralised for the 2026 tournament | Not consistently applied |
| Match importance | WSPDynamic — tournament finals weighted 3× over friendlies | Fixed weighting by confederation |
| Margin of victory | WSPGoal difference multiplier (capped at 3 goals) — a 3-0 win counts the same as a 7-0. Real dominance, not minnow-bashing. | Win is a win; score doesn't matter |
| Data depth | WSP125+ years, 309 national teams, every competitive match on record | Varies; recent results weighted more heavily |
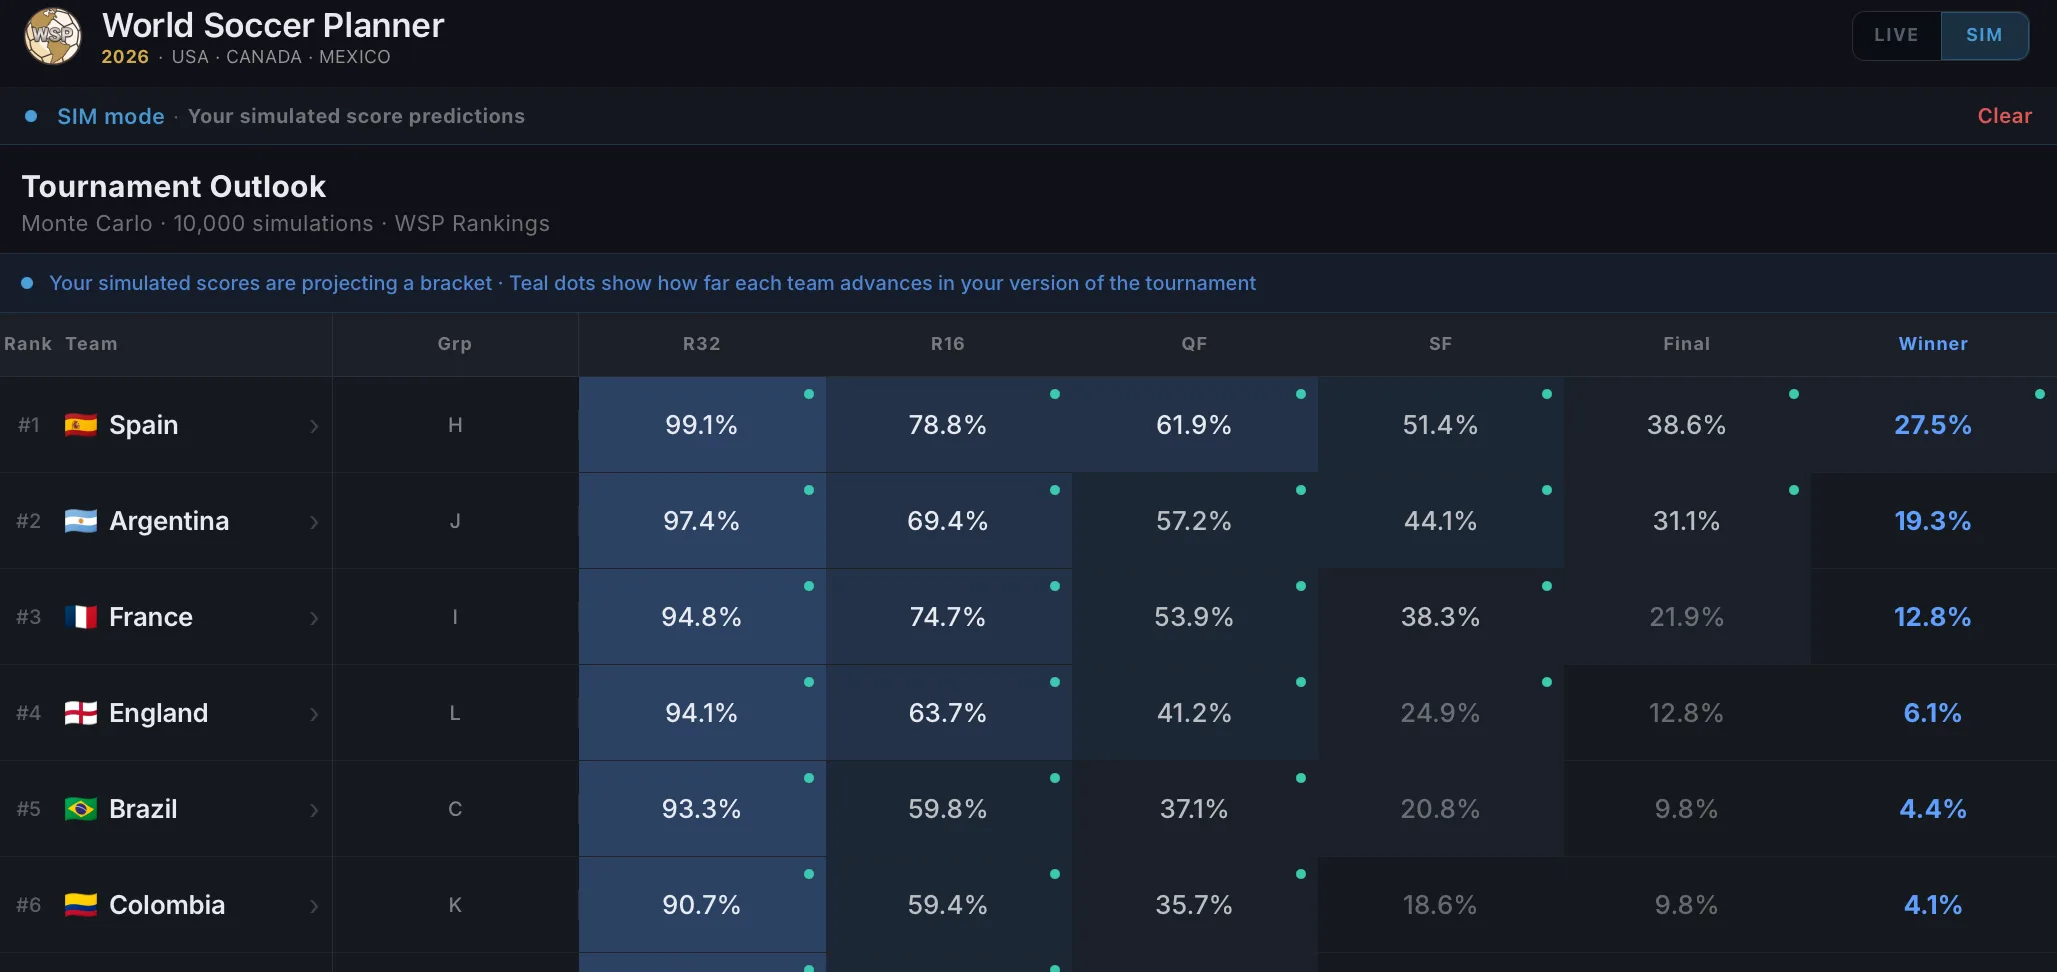
| Tournament predictions | WSP10,000 Monte Carlo simulations, updated after every result | None — rankings are not predictive by design |
| Agenda | WSPPredictive accuracy | Participation, confederation balance, consensus |
When you see 70%,
this is what's behind it.
When you see a win probability in World Soccer Planner, you're seeing a calculation backed by 125+ years of international football data, four model enhancements, and 10,000 Monte Carlo tournament simulations — run fresh after every result. It's the closest thing to an objective truth about who the better team is.
The model is honest about uncertainty. A 60/40 matchup is genuinely close. A 85/15 matchup reflects a real skill gap. We never inflate confidence to seem more certain than the data warrants.
Your model, not just ours.
We built the most rigorous model we could. But we also know you have opinions — and we built the tools to honour them.
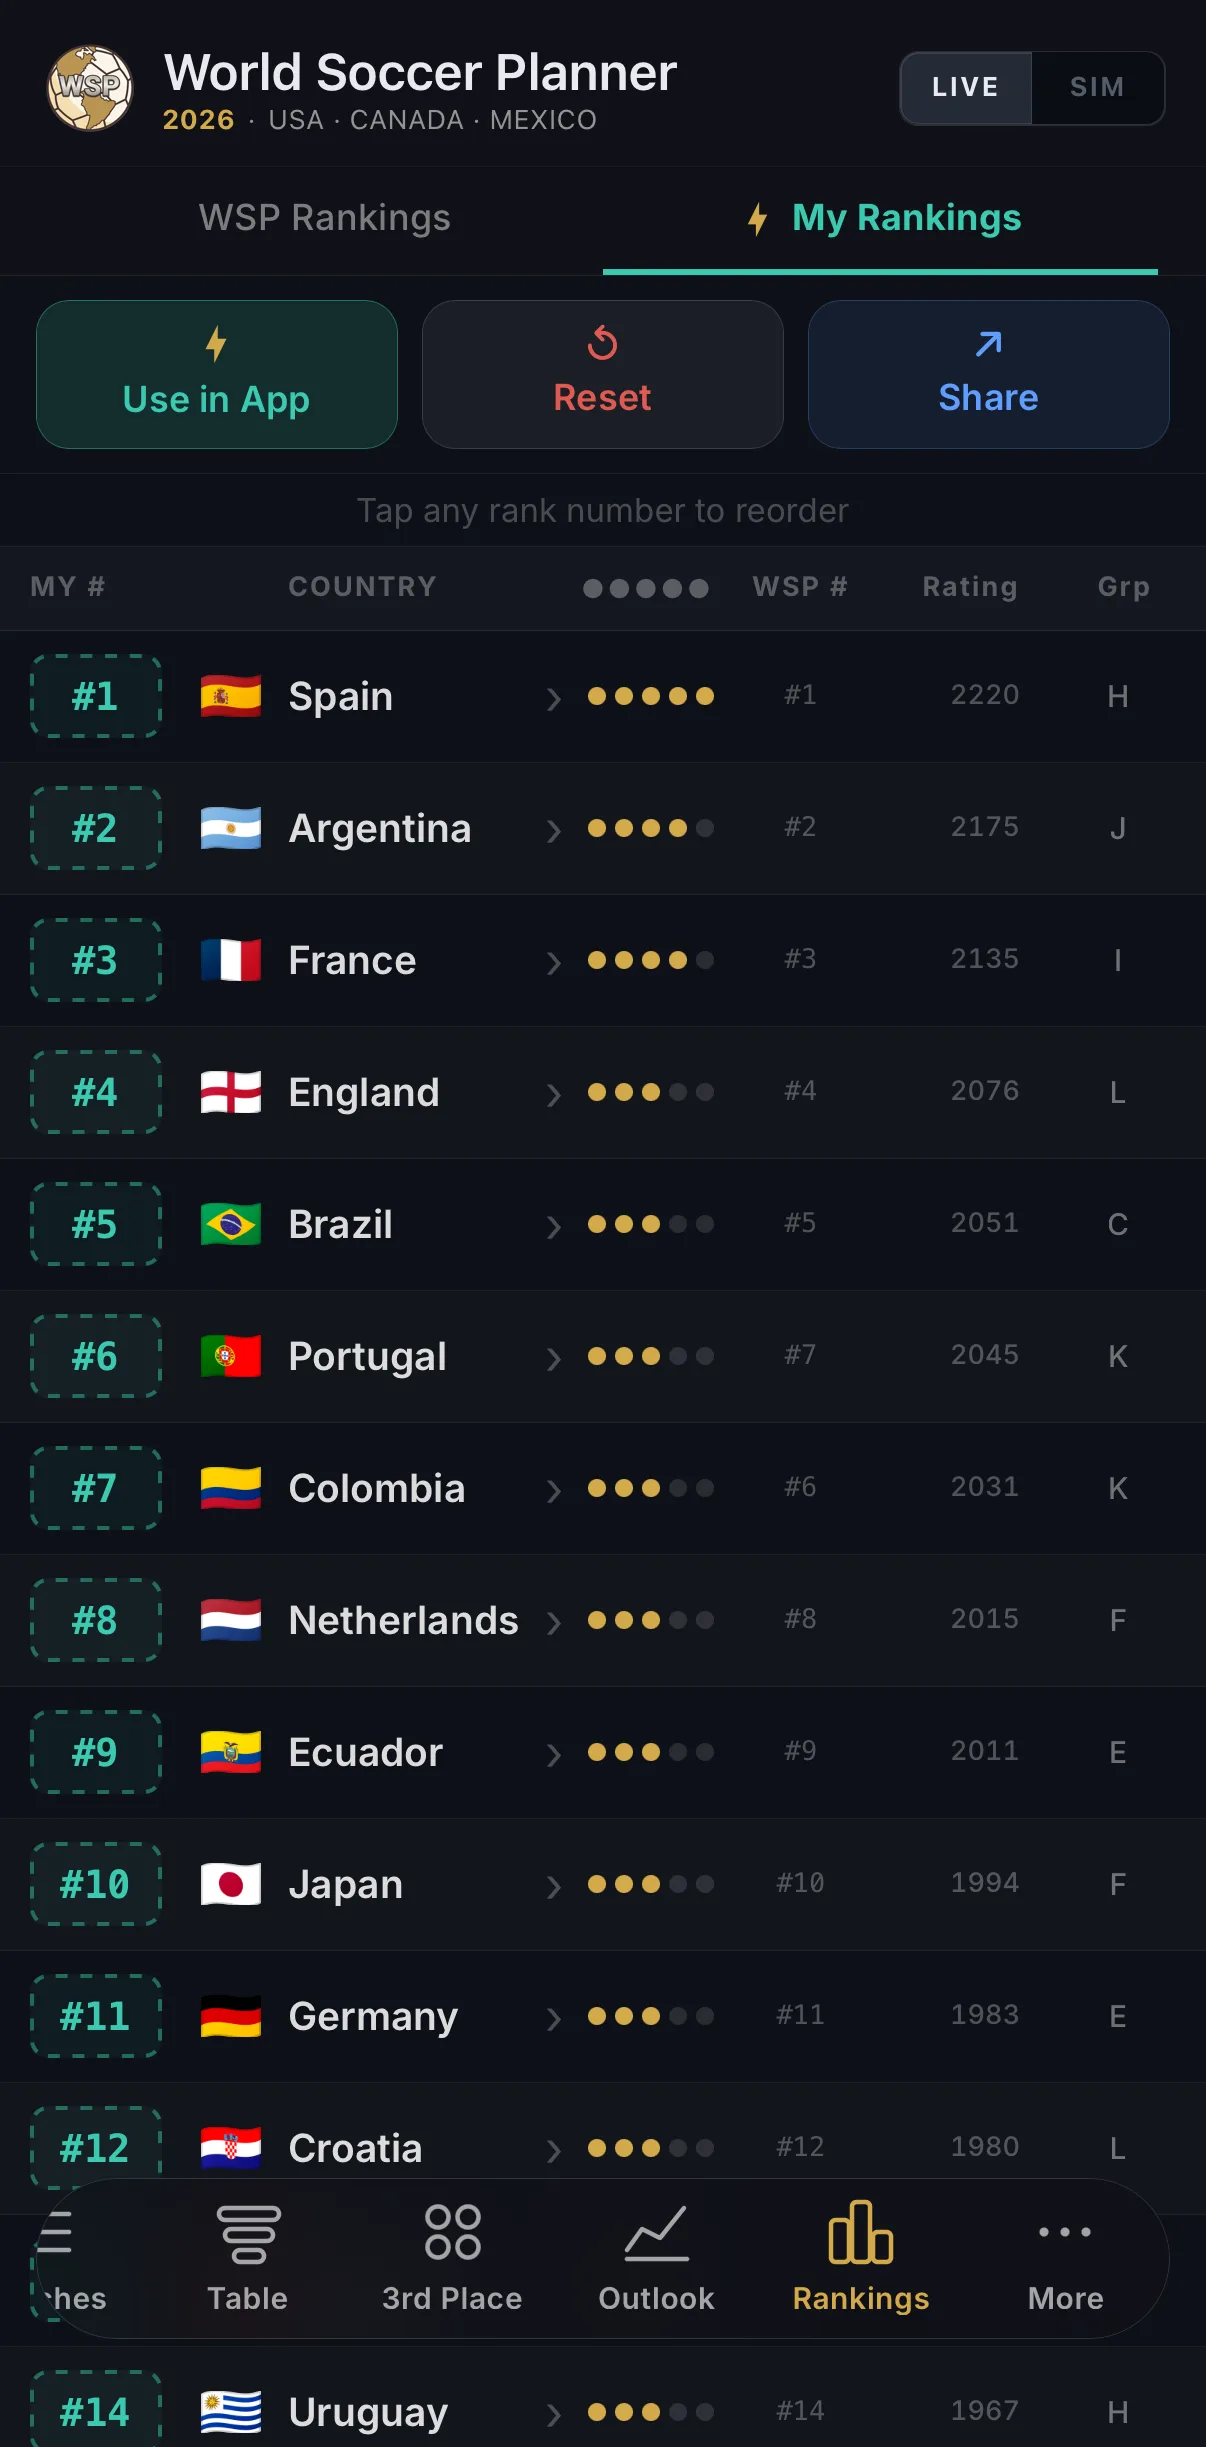
My Rankings lets you substitute your own team ordering into the same engine. Think England is better than France? Move England up. Every probability bar, every Team Path projection, every Tournament Outlook percentage updates instantly to reflect your call.
My Rankings runs 1,000 Monte Carlo simulations — fast enough to recalculate instantly as you reorder teams. The WSP model runs 10,000 for maximum precision. Both use the same ELO-based framework. The only difference is who decides where each team sits.
125+ years of data. 10,000 simulations. Our best objective answer to who is strongest.
Your opinion. 1,000 simulations. Fast, live recalculation as you reorder all 48 teams.
See the rankings in action
Every team. Every match.
Your model or ours.
Download World Soccer Planner to see every team's ELO rating, group assignment, and tournament advancement probability — updated continuously through the 2026 World Cup. Use our WSP Rankings or build your own model with My Rankings. Upgrade to Pro to unlock all features for the 2026 World Cup — one-time purchase, not a subscription. Pro covers the full 2026 tournament only. Future tournaments sold separately.